
Blogs
Core Web Vitals Explained: How to Pass Google's Page Experience Signals
Author : Logicloop admin
Publish Date : 2026-07-28
A few months back I opened a client's product page and timed it: under a second to load. Fast host, lean theme, images already squeezed down. On paper, a dream. Google Search Console called it poor anyway.
The real problem was a loyalty-program banner that slid down from the top about three seconds after everything else rendered. It shoved every product thumbnail down the page right as a shopper's thumb was drifting toward "add to cart." Nothing on that site was actually slow. It just moved when it had no business moving.
That's exactly the kind of thing Core Web Vitals are built to catch. It's also why so many teams get blindsided by a "needs improvement" label on a page that feels totally fine when they load it themselves.
Key Takeaways
- Core Web Vitals are three real-user metrics — LCP, CLS, and INP — that measure how a page actually feels, not how fast the server responds.
- Google grades each one at the 75th percentile of visits, split between mobile and desktop, so your fastest quarter of traffic can't carry a slow page.
- INP replaced FID as an official metric in March 2024 because FID only judged the first interaction and missed everything after it.
- Field data comes from real Chrome users on a rolling 28-day window, so fixes take weeks to show up in Search Console.
- Page experience works more like a tiebreaker than a dominant ranking signal — but the conversion argument for fixing it stands on its own.
What Core Web Vitals Actually Are
Core Web Vitals are a set of three measurements Google uses to judge how a real visitor experiences a page. Not how fast the server answers. Not how small the HTML file is. How it feels to a human on the other end.
They live inside a bigger idea Google calls page experience — the notion that a page can be relevant, well-written, and still frustrate people. It might be slow to show content, slow to react to a tap, or jumpy while it settles into place. All three are experience problems that good copy can't paper over.
Why It Matters for SEO and Conversions
Here's the part teams underestimate. Understanding what each metric tracks, and what usually breaks it, moves the needle on both rankings and revenue. A jumpy page doesn't just annoy Google's crawler. It loses the visitor who misclicks and bounces.
At Logicloop we've watched pages with genuinely strong content sit stuck at "poor" for one dumb reason — an unsized image, a late-loading widget — while the client swore the page was fine. It usually is fine. Right up until you measure it the way Google does.
What Google Is Trying to Measure
Ranking algorithms have always cared about relevance first, and Core Web Vitals don't change that. What they add is a standardized way to answer three narrow questions about any page:
- How long until the main thing a visitor came for is actually visible?
- How much does the page rearrange itself while it loads?
- How quickly does it respond once someone tries to interact with it?
Each question maps to one metric. Clean and specific, which is what makes them useful.
The Three Metrics, in Plain Terms
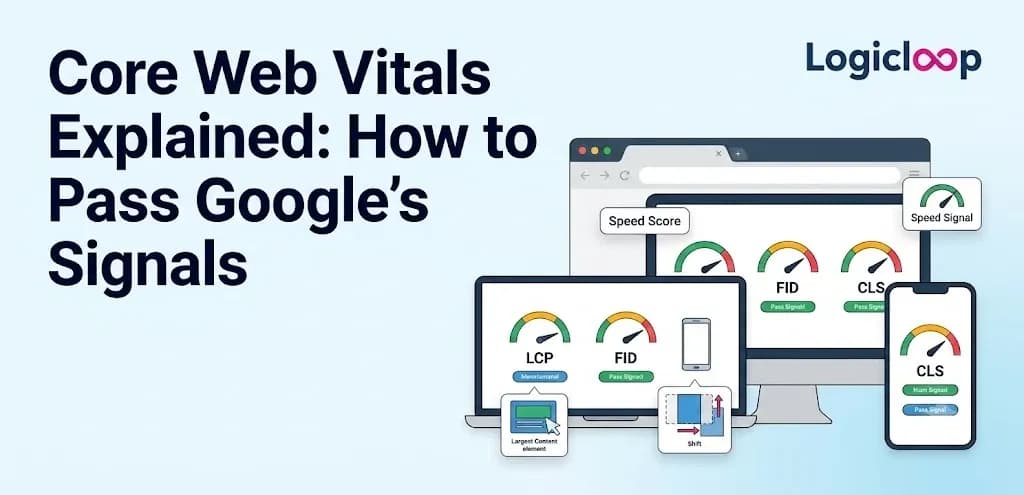
Largest Contentful Paint (LCP) measures how long it takes for the biggest visible element in the viewport — often a hero image, a headline, or a product photo — to finish rendering after someone requests the URL.
Cumulative Layout Shift (CLS) adds up every unexpected jump in the layout across the page's whole life and boils it down to a single unitless score.
Interaction to Next Paint (INP) watches every click, tap, and keypress, then reports how long the browser takes to visually respond to the slowest of them.
Why INP Replaced FID
That third metric is the new kid. For years, responsiveness was measured by First Input Delay (FID), which only clocked the delay before the browser started handling the very first interaction on a page.
Google retired FID and made INP the official Core Web Vital in March 2024. The reasoning is easy to see once you say it out loud: a page could ace FID on the first click and then stutter badly on the tenth. INP looks at the whole visit instead of just the opening handshake.
The Pass Thresholds You Actually Need
This is where the numbers matter, because "fast enough" isn't a vibe. It's a published cutoff.
| Metric | What it measures | Good | Needs improvement | Poor |
|---|---|---|---|---|
| LCP (Largest Contentful Paint) | Time until the largest visible element renders | 2.5 seconds or less | 2.5 to 4 seconds | Over 4 seconds |
| CLS (Cumulative Layout Shift) | Total unexpected visual movement during the page's life | Under 0.1 | 0.1 to 0.25 | Over 0.25 |
| INP (Interaction to Next Paint) | Responsiveness across all clicks, taps, and keypresses | 200 milliseconds or less | 200 to 500 milliseconds | Over 500 milliseconds |
Now the detail that trips people up. Google evaluates all three at the 75th percentile of visits, split between mobile and desktop. A page doesn't pass because the average visitor had a nice time. It passes when at least three out of every four visits hit the "good" mark.
So a page that dazzles on your office wifi and chokes on a mid-range Android over a spotty connection will fail — even when your own testing looked spotless. That slower quarter of visits? That's precisely what the 75th percentile is designed to surface.
Pro Tip: Test on a throttled connection and a cheap device, not your own machine. Chrome DevTools can simulate a mid-tier Android on slow 4G in two clicks. If the page holds up there, it'll hold up in the field data too.
Why LCP Breaks More Often Than People Expect
The reflex when LCP is slow is to blame the image size. Sometimes that's right. More often, in my experience, LCP fails for reasons that have nothing to do with the file itself.
Take lazy-loading. A hero image set to lazy-load by default tells the browser to wait until the image is about to scroll into view before fetching it. Except it's already in view on page load. So the browser cheerfully delays the one element it should be rushing.
The Usual Suspects Behind Slow LCP
- Render-blocking CSS and third-party fonts. The browser can't paint anything until it downloads and parses a stylesheet sitting on a server halfway around the world.
- Slow server response (time to first byte). Cheap shared hosting or an unoptimized database query drags LCP down before a single pixel appears — even on otherwise lean, clean code.
- Lazy-loading the wrong element, as above. The thing you most want to prioritize gets deprioritized.
How to Fix LCP
Fixing it usually comes down to a short list of concrete moves:
- Serve the hero image at the size it actually displays, not the giant original.
- Use a modern format like WebP or AVIF.
- Preload the LCP element instead of lazy-loading it.
- Inline critical CSS so the browser isn't waiting on an external file to start painting.
- Push static assets onto a CDN so they load from somewhere physically closer to the visitor.
None of this is exotic. The real trick is confirming which resource is the LCP element on a given page first, because it's often not the one you'd bet on.
CLS Is Usually a Symptom of Something Loading Late
Layout shift is rarely one glaring mistake. It's death by a thousand small ones.
Images and video embeds with no width and height attributes are the classic culprit. The browser can't reserve space for them until the file downloads, so everything below jumps the moment they arrive. Custom web fonts pull the same trick — a fallback font renders first, the custom one swaps in later with different spacing, and the whole paragraph reflows.
Ads and injected widgets are frequent offenders too, especially anything a script drops in after the page has already settled. Which is exactly what that loyalty banner was doing to my client.
Fixing Layout Shift
The fix is one principle applied in different spots: reserve the space before the content shows up.
- Set explicit width and height on every image and video.
- Use font-display settings that avoid a jarring swap.
- Give ad slots and dynamic banners a fixed minimum height so they can't shove content around when they finally load.
It's unglamorous work. It's also some of the highest-impact optimization you can do, because CLS fixes tend to be fast once you've spotted the shifting element.
INP and the Cost of a Busy Main Thread
INP problems trace back to JavaScript more often than not. Every interaction has three phases: the input delay before the browser can start handling the click, the processing time your event handler needs to run, and the presentation delay before the updated pixels hit the screen.
When a page feels laggy after a tap, it's usually because the browser's main thread was busy running something else — a long JavaScript task, a bloated third-party script, an analytics tag — when the click landed. So the response gets stuck in line behind it.
Where INP Trouble Hides
Sites loaded with third-party scripts struggle here even when their own code is tight. Chat widgets, heatmap trackers, ad tech — every one of them fights for the same main thread. Here's what helps:
- Break large JavaScript tasks into smaller chunks so the thread can breathe between them.
- Defer non-critical scripts until after the page is interactive.
- Move heavy computation off the main thread with web workers.
- Audit what's actually running and cut anything that isn't earning its spot.
You'll almost always find a marketing tag installed two redesigns ago that nobody remembers adding and nobody would miss.
How Google Actually Collects These Numbers
This part changes how you should react to your scores, so it's worth a minute.
Google's official field data comes from the Chrome User Experience Report (CrUX) — a dataset built from real Chrome users who opted into sharing usage stats. Not a single test run. That's what feeds the Core Web Vitals report in Search Console and the field data section of PageSpeed Insights.
Lab data is a different animal. It's a simulated page load on a fixed device and network, run on demand. Great for debugging one specific change, but it won't always match what real visitors see — especially if your audience skews toward older phones or slower connections.
Field Data vs. Lab Data
| Field data (CrUX) | Lab data | |
|---|---|---|
| Source | Real Chrome users | Simulated single load |
| Device & network | Whatever your actual visitors use | Fixed profile |
| Timing | Rolling 28-day window | On demand, instant |
| Best for | Judging if a page truly passes | Debugging a specific fix |
| Shows up in | Search Console, PSI field section | PSI lab section, DevTools |
That distinction explains a frustrating pattern. You fix something, test it in PageSpeed Insights, see a beautiful lab score, then watch Search Console stay stuck on "poor" for weeks.
Field data is a rolling 28-day window of real traffic. It takes time to catch up to a code change. Patience is part of the process here, not a sign your fix flopped.
Where This Sits in the Ranking Picture
It's tempting to treat Core Web Vitals as a lever you yank to jump up the results. That's not really how it plays out.
Google has been consistent that page experience acts more like a tiebreaker than a dominant ranking signal. When two pages are similarly relevant to a query, the one with the better experience gets the edge. A keyword-stuffed page riddled with layout shift and lag isn't going to leapfrog a slower competitor with genuinely better content.
The Business Case Doesn't Depend on Rankings
Even set the ranking argument aside and the math still works. Slow, jumpy pages lose people. Visitors bounce before a hero image finishes loading. They misclick because the page shifted under their thumb right as they went to tap "buy now." Those are lost conversions no matter what the algorithm does.
A Practical Optimization Checklist
Run through this before you call a page done:
- Confirmed which element is the LCP element on the page (don't assume).
- Hero image served at display size in WebP or AVIF, and preloaded, not lazy-loaded.
- Critical CSS inlined; render-blocking resources minimized.
- width and height set on every image and video.
- font-display configured to avoid a jarring font swap.
- Ad slots and dynamic banners given a reserved minimum height.
- Non-critical scripts deferred until after the page is interactive.
- Third-party tags audited; anything unused removed.
- Static assets served from a CDN.
- Verified on a throttled mid-range mobile device, not just desktop.
Common Mistakes to Avoid
Testing only on your own hardware. Your laptop on office wifi is the best-case scenario, and Google grades the 75th percentile, not the best case.
Reacting to lab scores alone. A green lab result feels good but doesn't move the field data that actually decides pass or fail.
Treating it as a one-time project. A redesign, a new plugin, or a tag added six months from now can quietly undo today's work.
Chasing LCP with image compression only. Half the time the real culprit is lazy-loading, render-blocking CSS, or a slow server — not the file size.
Real-World Example: The Banner That Broke a Fast Page
Back to my client. The page loaded in under a second and still got flagged poor. Lab tools looked clean, LCP was fine, INP was fine.
The whole score came down to CLS — that loyalty banner injecting itself three seconds in and shoving the product grid down. The fix took about twenty minutes: reserve a fixed slot so the banner held its space from the start instead of elbowing in later. CLS dropped under 0.1, though Search Console didn't reflect it for nearly a month while the 28-day field window rolled forward. Nothing was broken. The data just needed time.
Frequently Asked Questions
What are the three Core Web Vitals?
Largest Contentful Paint (LCP), Cumulative Layout Shift (CLS), and Interaction to Next Paint (INP). They measure loading speed, visual stability, and responsiveness — the three things that most shape how a page feels to a real visitor.
What are the passing thresholds for Core Web Vitals?
You want LCP at 2.5 seconds or less, CLS under 0.1, and INP at 200 milliseconds or less. Anything in the middle bands lands you in "needs improvement," and beyond them you're "poor."
When did INP replace FID?
INP became the official Core Web Vital in March 2024, replacing First Input Delay. FID only measured the delay on the first interaction, while INP evaluates responsiveness across the entire visit.
Why does my page pass in PageSpeed Insights but fail in Search Console?
PageSpeed Insights lab data is a single simulated load, while Search Console uses real-user field data from CrUX on a rolling 28-day window. A fix shows up in the lab immediately but takes weeks to move the field data.
What does the 75th percentile mean for Core Web Vitals?
Google grades each metric at the 75th percentile of visits, split by mobile and desktop. At least three out of four visits must hit the "good" threshold, so your fastest traffic can't compensate for a slow tail.
How do I fix a slow LCP?
Serve the hero image at its display size in WebP or AVIF, preload it instead of lazy-loading, inline critical CSS, speed up server response, and use a CDN. First, confirm which element actually is your LCP element.
What causes layout shift (CLS)?
Images and videos without set dimensions, custom fonts that swap in late, and ads or widgets injected by scripts after the page has settled. The fix is to reserve space for these elements before they load.
Is INP mostly a JavaScript problem?
Usually, yes. Long JavaScript tasks and heavy third-party scripts keep the main thread busy, so interactions get queued behind them. Breaking up long tasks, deferring non-critical scripts, and using web workers all help.
Do Core Web Vitals directly boost my rankings?
They act more like a tiebreaker than a primary ranking factor. Between two similarly relevant pages, the better experience wins — but great vitals won't outrank genuinely better content on their own.
How often should I check Core Web Vitals?
Treat it as ongoing maintenance, not a one-time task. Search Console and PageSpeed Insights give you snapshots; real-user monitoring tools like DebugBear track the metrics continuously so a future plugin or tag doesn't quietly undo your work.
Final Thoughts
Core Web Vitals aren't a box you tick once and forget. They're closer to a maintenance habit — the way you'd keep an eye on page speed or broken links — because the things that break them creep back in one small change at a time. An unsized image here. A heavy script there.
Start where the signal is real: Search Console for field data, PageSpeed Insights for a page-by-page view of both field and lab results, and a real-user monitoring tool if you want continuous eyes on it. Fix the LCP element, reserve space so nothing jumps, keep the main thread clear, then give the 28-day window time to catch up.
If you'd rather have someone diagnose exactly what's dragging your scores down and fix it, that's the work the team at Logicloop does every day. Either way, the goal is the same — a page that shows up fast, stays put, and responds the instant someone taps.